
Month to date, versus the US dollar, Europe’s single currency is lower by -1.3% and has erased all of December’s upside.
Multi-timeframe technical approach highlights nearby resistance
The Research Team acknowledged the following in recent analysis regarding the monthly timeframe:
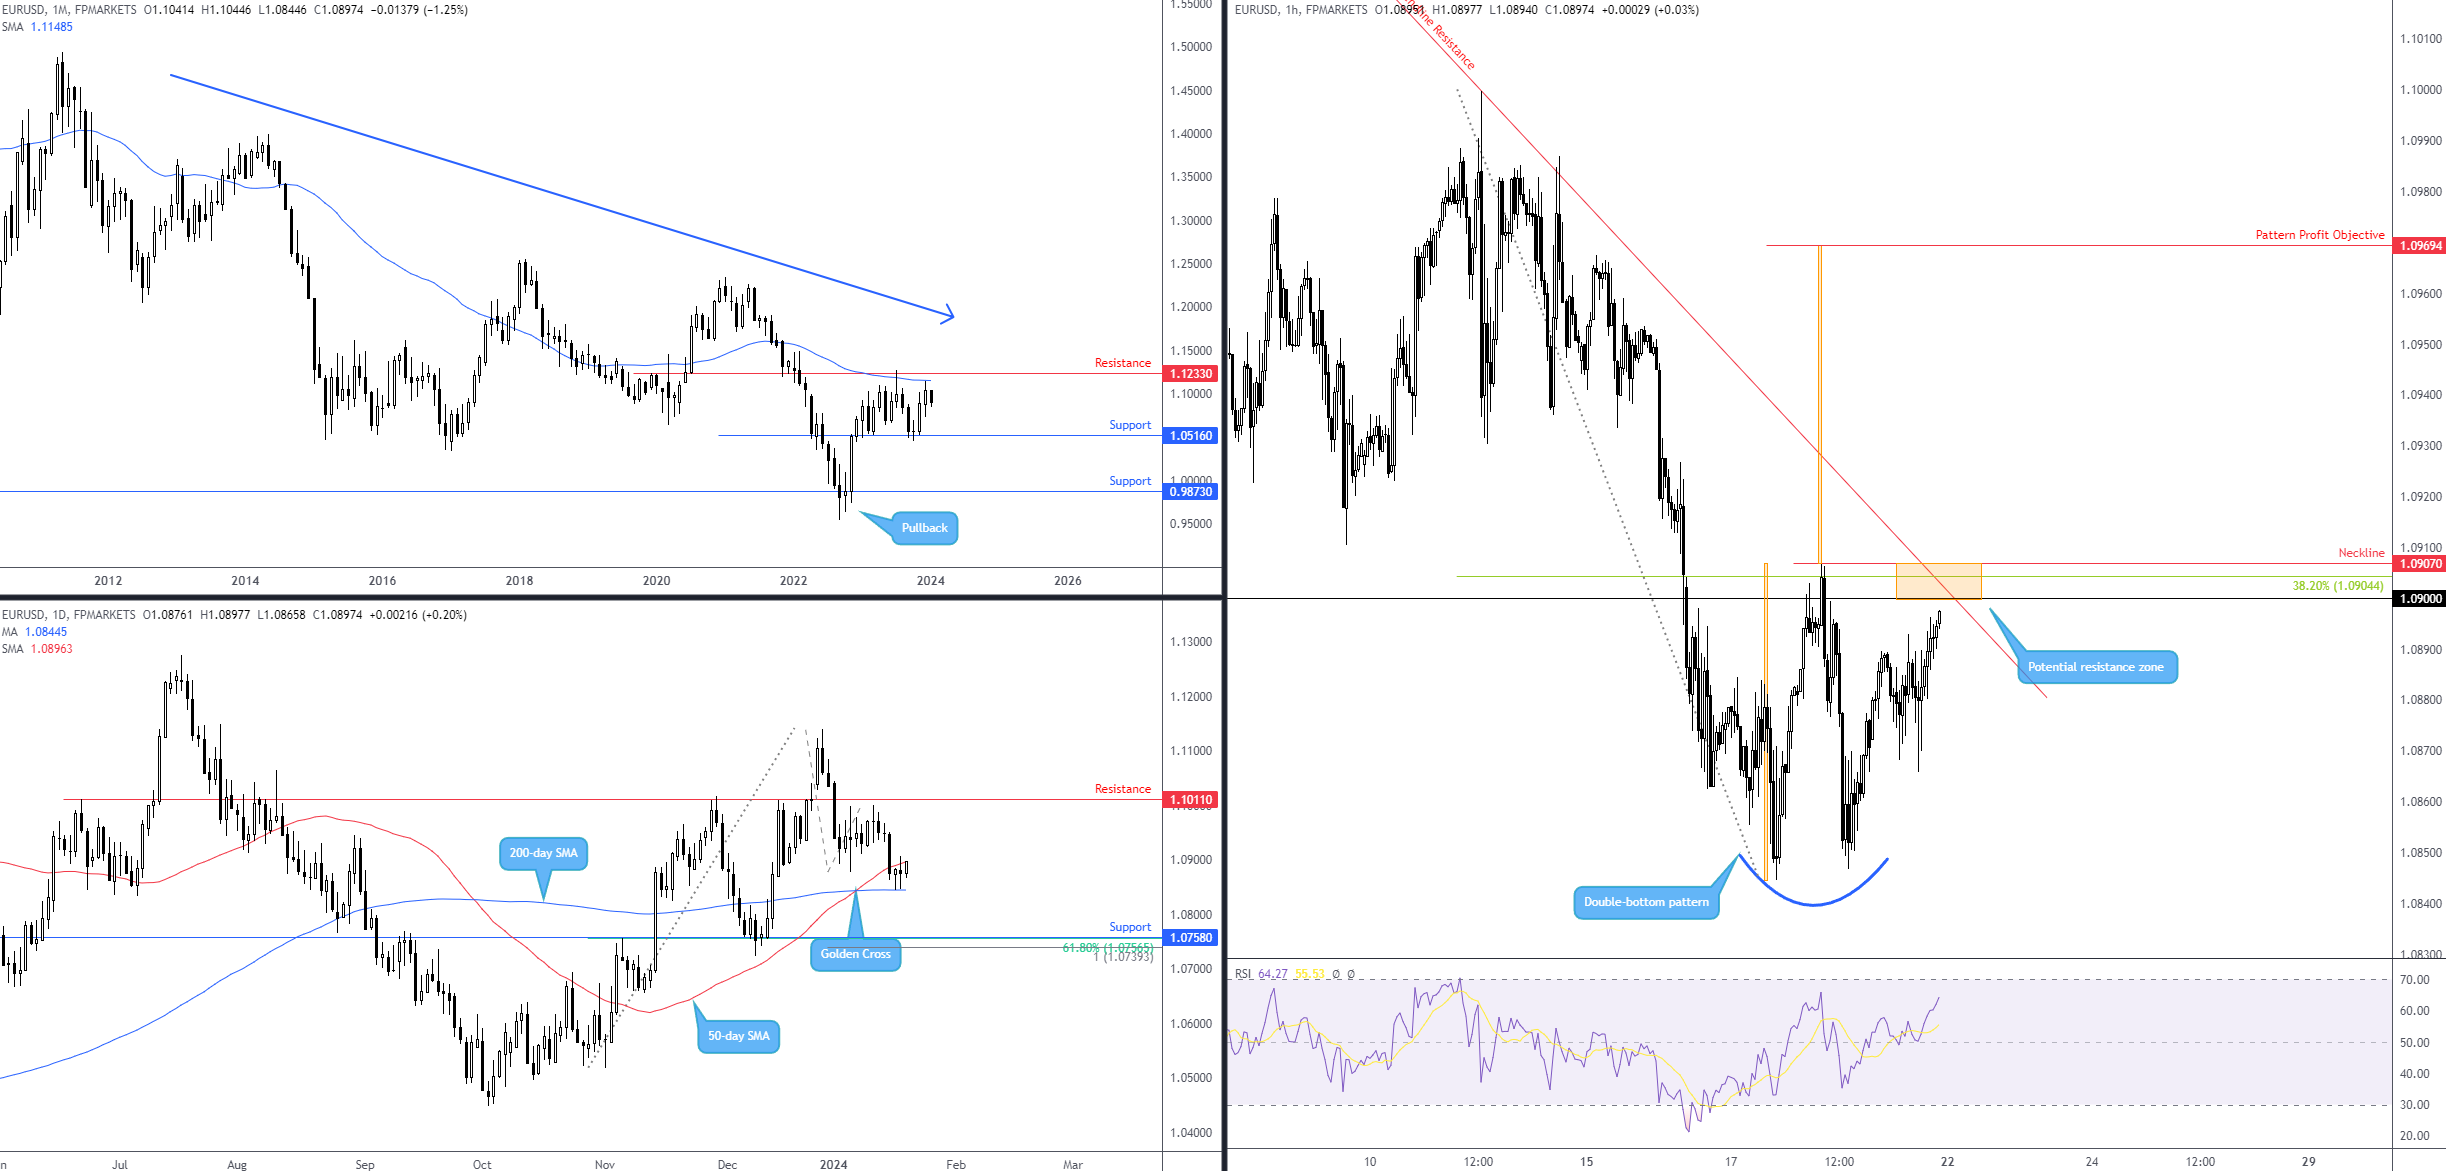
Overall, the currency pair has been in a downward trend since 2008, fashioned through a series of lower lows and lower highs evident on the monthly chart. Also apparent from this chart, the pullback from the September (2022) low of $0.9536 could be viewed as a long-term sell-on-rally scenario.
Monthly resistance warrants attention overhead at $1.1233 and shares chart space with a 50-month simple moving average (SMA) at $1.1149. Equally, support from $1.0516 is noteworthy, a level that welcomed buyers in November 2023. Ultimately, given the downtrend in the EUR/USD, $1.1233 resistance will likely be a difficult barrier to penetrate and, thus, perhaps encourage selling if challenged again. Breaching current support, therefore, might be the long-term technical objective as of now, opening the door towards monthly support at $0.9873.
From the daily timeframe, you will note that price movement concluded the week flanked by the 50-day and 200-day simple moving averages at $1.0896 and $1.0845, respectively. You may recognise the pair discovered support from the latter in the second half of last week, and a Golden Cross materialised earlier this month—a long-term trend reversal signal, which somewhat conflicts against current price action: a fresh lower low that indicates the early phase of a downtrend. Beyond the moving averages, resistance is at $1.1011 and support falls in at $1.0758 (complemented by a 61.8% Fibonacci projection ratio and a 100% projection ratio at $1.0739 [a simple harmonic AB=CD pattern]).
Meanwhile, the short-term H1 chart finished the week on the doorstep of a resistance zone between $1.0907 and $1.0900. Albeit small, the area consists of several technical tools to form rather meaningful confluence, including trendline resistance extended from the high of $1.1139, a double-bottom pattern’s neckline and Fibonacci retracement ratios. Should price engulf this resistance area this week, buyers could enter the fray based on the double-bottom pattern’s ($1.0845) completion (neckline breach), in which a profit objective tends to be derived from the base value and extended from the breakout point (in this case, $1.0969).
Direction for the week ahead?
Having noted the longer-term monthly trend facing south, and price action on the daily timeframe showing signs of an early downtrend (lower high followed by a subsequent lower low), as well as daily price ending the week testing the underside of the 50-day SMA at $1.0896, the H1 resistance zone between $1.0907 and $1.0900 could be a location sellers draw to in early trading this week. However, in the event of a breakout higher, not only would this see daily price navigate terrain north of the 50-day SMA, it would also essentially deliver the green light for short-term longs based on the H1 double-bottom pattern, targeting $1.0969.
Source: TradingView
 previous

