
Outlook: The week has PMI’s already out and the US to come (with services on Wednesday). The Institute for Supply Management mfg index is expected to fall to 52.1 in July from 53, with all eyes on prices paid. We have two central bank meetings, Australia and UK, on Thursday. Later in the week it’s a ton of industrial output data, including German orders. As usual, though, attention is going to center on US nonfarm payrolls on Friday, with everyone ignoring JOLTS tomorrow.
About the yen–we switched to long yen against the dollar, euro and AUD without any real confidence it will last. Probably the question about to rise to the surface is intervention should this turn into a runaway train. We doubt anyone can name the area where the BoJ runs out of patience but some obvious numbers come to mind, like the previous dollar low at 126.36 from May 24.
We show the weekly chart to highlight how big a deal this really is. We are inclined to think the previous low is not meaningful and the line in the sand, when it comes, will be far lower, like 115. The key idea to justify jawboning/intervention is “lack of stability.” Wait for that word. It would be helpful if we understood the motivation behind traders buying yen again in the absence of some scary risk favor. It seems to be a sui generis move without rhyme nor reason. If it’s a function of expecting the yield diff not to widen because the Fed will chicken out, that’s a super high-risk “reason.”
About that recession: for what it’s worth, the Atlanta Fed has now started to show us Q3 and it’s back in the black at 2.1%. We get another estimate today.
No choice–we must speak about the elephant in the room. All economists say the definition of recession as two negative quarters is not a good definition, and damn the NBER. Non-economists are royally ticked off by that and accuse economists of every crime possible, including old-fashioned incompetence. (Republicans say Dems are liars, which is rich.)
This is unfair because the underlying assumption is wrong–that economists have reliable semi-scientific models of how economies work, every economist agrees with them, including definitions of words, and those models are correct a high percentage of the time. For example, last week’s law requiring companies with a billion dollars is revenue can no longer use loopholes to avoid paying any tax at all (GE, Google) and must pay a minimum tax of 15%. Economists who favor tax fairness approve. Economists who assert (without evidence) that the tax steals money that can go to R&D disapprove. Who’s right? Well, possibly both camps.
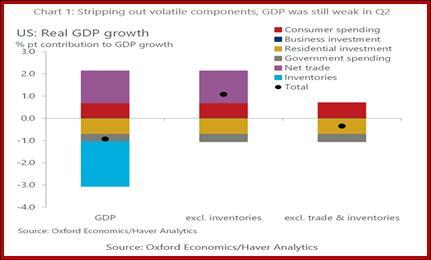
To criticize economists for not agreeing on the definition of recession implies everyone agrees that GDP, which is an aggregate, is the best criterion. But see the chart below from Oxford Economics–we can divvy up GDP to show weakness, not outright recession. It’s not really a basic misunderstanding of what economics can and cannot do. It’s a desire to over-simplify a horrifyingly complex and complicated machine with literally millions of moving parts. Quick, think of another profession where diagnosis and prognosis is so slippery. We can do better forecasting employment and wage growth than cancer recurrence, for example. In fact, the statistics on nutrition and various health maladies are so bad we might as well live on coffee and eggs. (Eggs are no longer a cholesterol issue, by the way. Coffee has spun from awful to wonderful three times we know of.) And despite the simply wonderful advances in meteorology, if you live in Kansas you are lucky to get a one-hour tornado warning.
Economics is not a science. It’s called a social science, but that’s just a courtesy because we do use statistics and we do build models, without having the ability to bring into those models critical factors like demographics and other structurals. Every tourist knows Europe has far better infrastructure than the US. Which airport do you prefer, Geneva or LaGuardia? How does this affect logistics and economic growth? Some economist somewhere knows. You can bet the chief economist of the city of Los Angeles hates looking at the port data and trying to incorporate it into the forecast for (say) city tax revenue. But binding all the data into one model is literally impossible (Wharton tried and gave up long ago) and has to be done piecemeal, which takes the patience of Job.
And yet really first-class economists can offer such refinements if we only have the patience to pay attention and drive deep instead of simply accepting “stockbroker economics.” We are guilty of accepting stockbroker economics ourselves–when nonfarm payrolls misses the forecast by x, by know which way the S&P and the dollar will go. If your job is forecasting financial prices, stockbroker economics can suffice.
But when speaking of the future of our world, it pays to dig deeper, as in this splendid chart by Oxford. It demonstrates how structural issues are highly likely to alter the comparability of monetary policy effectiveness the UK, eurozone and US going forward. Here is the full text. It may be more than you want to read but eat your spinach–it has permanently changed our outlook on the euro, especially because to the extent the market sees and believes this line of argument, the ECB can “get away with” less hiking than the US without it harming the euro.
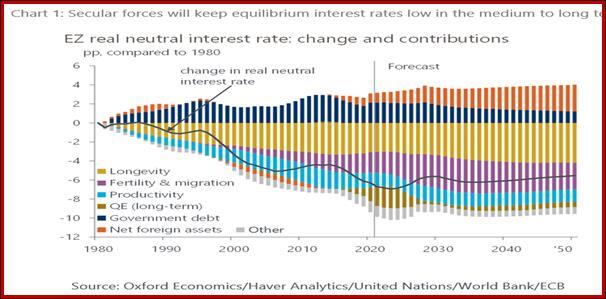
Andrew Bailey, governor of the Bank of England, recently warned that in the not-too-distant future central banks could have to reverse their rate-hiking cycles, which are aimed at putting out the blaze of record-high inflation. The reason is that the structural forces that have been pushing global interest rates down over past decades may come to the fore again once current shocks dissipate. We have been making this same argument for some time, but while Bailey's analysis ends in 2015, we have quantified the impact of structural forces through to 2050.
Governor Bailey stressed the point that these structural forces – such as demographic change and slowing productivity growth – follow global trends affecting all major economies. To some extent, this is true. But our analysis also shows it's important to take regional differences into account and model international capital flows explicitly.
The eurozone, for example, has an older population than the world average and is projected to continue ageing relatively fast. As a result, since 1980 the drop in the eurozone's real neutral interest rate – the interest rate consistent with inflation at target and production at potential – has been bigger than the world average. Due to the bleak outlook for the bloc's demographics, we expect its neutral rate to remain negative in our forecast to 2050.
Governor Bailey focused on the global neutral rate as a long-run anchor for the UK on the basis that capital can flow relatively freely around the world. By contrast, former US Fed chairman Ben Bernanke emphasised the importance of capital flows for regional interest rates, arguing that the savings glut in Asian economies and other EMs depressed interest rates in the US.
The truth is a bit of both, in our view. Our analysis shows that demographics are likely to reinforce international capital flows in the future, moving diverse regional neutral rates towards the global rate.
So, yes, economists do not know enough that is critically useful for forecasting and we know it. We have to keep delving into all kinds of things before we can speak, and even then we have to be weaselly and use terms like “probably” and “likely.”
We do know that since 1948, every recession was preceded by an inverted yield curve and peak employment. Does that mean the inverted yield curve and high employment this time mean inevitable recession? Yes, almost certainly–just not now in August 2022. When? Well, 6-12-18 months, which is about the same lag as for monetary policy delivering measurable effects. That’s why the current bond market model calls for the Fed to do another 100-150 points in Sept through December but then start seeing “results” of moderating inflation, which will stay its hand in Q2 of 2023, if not Q1. We think they are wrong and inflation has years, not months, to run, but never mind. The sad fact is that a plausible scenario is as defensible as an implausible one under the present circumstances.
Applying other rules–we need unemployment to get a whole lot higher before it affects demand, for which retail sales is a good proxy. From 3.6% now to–what? 6-8-10% again? We need prices paid in places like the ISM manufacturing index to start coming down–not just gasoline at the pump. Bottom line–we are a long way from inflation relief and accordingly, a long way from the Fed chickening out. As this awful realization sets in, we can see waves of dollar firmness alternating with the current mindset. That’s going to make “the dollar” move differently against various currencies, especially the emerging markets (which are already confused enough). When in doubt, play the crosses.
This is an excerpt from “The Rockefeller Morning Briefing,” which is far larger (about 10 pages). The Briefing has been published every day for over 25 years and represents experienced analysis and insight. The report offers deep background and is not intended to guide FX trading. Rockefeller produces other reports (in spot and futures) for trading purposes.
To get a two-week trial of the full reports plus traders advice for only $3.95. Click here!
 previous

