
EUR/USD Current Price: 1.0028
- Market participants remain concerned about economic growth and aggressive monetary tightening.
- Germany's inflation kept rising in August, according to preliminary estimates.
- EUR/USD is holding on to modest gains above 1.0000, but buyers are losing interest.
The EUR/USD pair posted a modest daily advance on Tuesday, trading at around 1.0030 heading into the Asian opening. The shared currency overcame persistent dollar demand as investors still increased bets on an ECB 75 bps rate hike in September. Financial markets kick-started the day with a better tone, but the sentiment soured ahead of Wall Street’s opening. Asian and European equities closed in the green, but US indexes edged firmly lower as government bond yields resumed their advances.
Generally speaking, market participants are concerned about slowing growth, exacerbated by aggressive monetary policies meant to take down inflation. Federal Reserve chief Jerome Powell acknowledged the burden of higher rates on households and economic progress but made it clear the central bank would continue with the tightening plan.
Meanwhile, macroeconomic data was mixed. The August EU Economic Sentiment Indicator contracted to 97.6 from 98.9, worse than expected. Consumer Confidence in the same period remained unchanged at -24.9. German inflation, in the meantime, was higher than anticipated in August, up by 7.9% YoY, according to preliminary estimates. US figures were more encouraging, as the JOLTS Job Openings report showed 11.24 million job openings in July. The Conference Board Consumer Confidence improved in August to 103.2 after falling in the previous three months.
On Wednesday, the EU will release the preliminary estimate of its August Consumer Price Index, which is foreseen to be up by 9% YoY, a new multi-decade high. On the other hand, the US will publish a revamped ADP Employment Change report on private job creation. ADP has changed how it calculates the figure, and this first release of the new report may have a limited impact on price behavior.
EUR/USD short-term technical outlook
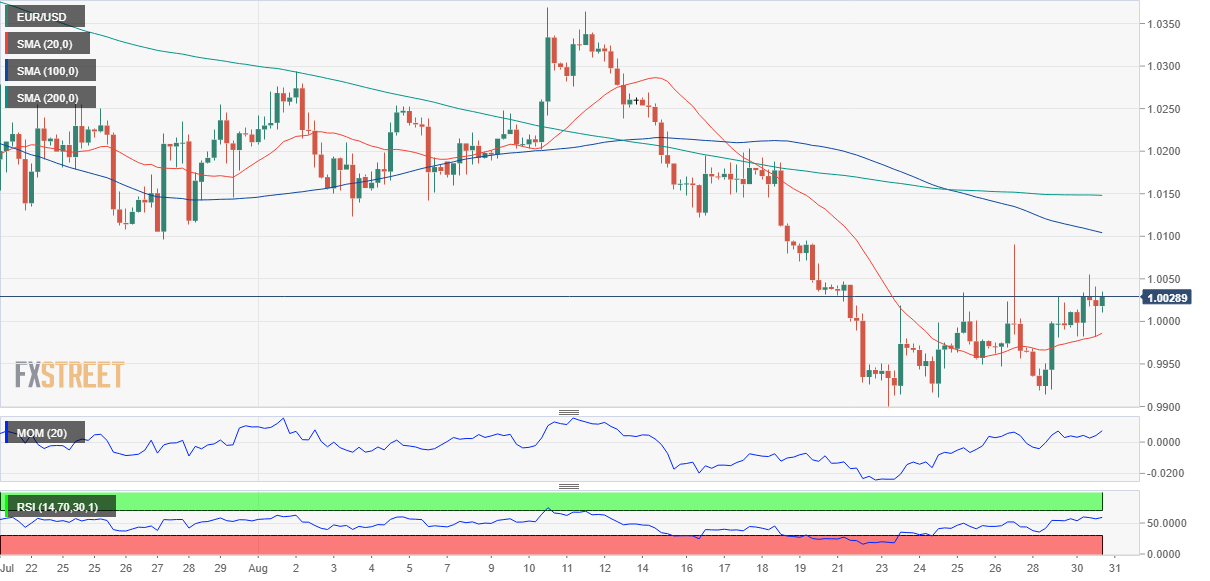
Despite the intraday advance, the daily chart for the EUR/USD pair shows that the risk remains skewed to the downside. The pair keeps developing below bearish moving averages, with the 20 SMA providing dynamic resistance at around 1.0120. The Momentum indicator turned south well below its midline, while the RSI indicator hovers around 40, reflecting bears are still in control of the pair.
The 4-hour chart hints at decreasing buying interest. The pair remains above a mildly bullish 20 SMA, which provided intraday support, although the longer moving averages stay well above the current level, with the 100 SMA gaining bearish traction. At the same time, the Momentum indicator turned south within neutral levels, while the RSI indicator is currently flat at around 54. The aforementioned 20 SMA stands at around 0.9980, the level to break to confirm a near-term bearish continuation.
Support levels: 0.9980 0.9940 0.9895
Resistance levels: 1.0030 1.0080 1.0120
View Live Chart for the EUR/USD
 previous

