
Outlook: Markets are skipping back and forth between fear of inflation and fear of recession. This results in some peculiar price actions. For what it’s worth, the Bloomberg
Economics’ “probability of a recession in the next 12 months at 38%, up from zero just months ago. Morgan Stanley predicts the euro-area will slide into a recession at the end of 2022, and Citigroup analysts reckon the odds of a worldwide pullback in the next two years are about even.”
We can’t resolve the issue and even if we had a perfect crystal ball, it might not tell us how to trade because the process of getting there bends and kinks some other things. Twilight Zone music.
We saw it is spades yesterday–commodity prices mostly lower while the 2/10 ran to -0.04. These two things are not necessarily at odds, but certainly not “normal.” The 2/10 spread ran up, it ran down, it ran up again. It’s slippery as a greased pole. Meanwhile, the European bond market (aka the Bund) is far steadier and on a rising trajectory, with a bump or two.
This implies two things—the market in US Treasuries is wobbly and somewhat indecisive between the idea the Fed will back down and the Fed will not back down. In any event, we will know fairly soon—Powell’s fancy inflation forecast comes on July 15 (the index of common inflation expectations) and the policy meeting itself is July 27.
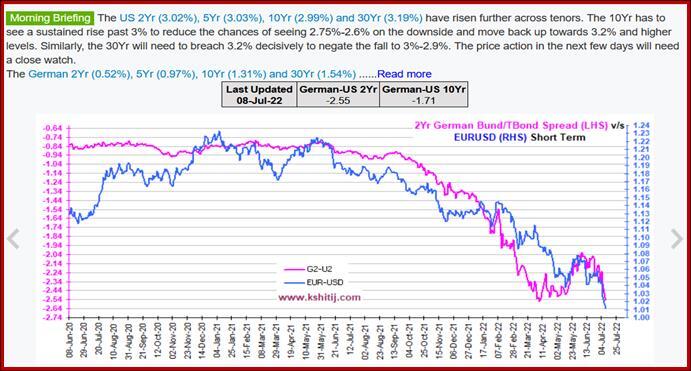
We have to wait a lot longer for the ECB to decide whether to fight inflation or fight recession, and so far it looks like it would rather fight recession, with wimpy rate hikes (if any). This means the yield gap is widening. A widening yield gap favors the hiker. The correlation of the two-year differential with the euro/dollar is strong. See the chart from kshitij.com. Deduction: that Shock that takes the euro to parity might be on the schedule as soon as the market comes to accept this is the picture. If so, expect an overshoot.
So, which asset is right—bonds, equities commodities and what about those oil prices? A drop in most commodities, ex-European oil and natgas, implies recession might not be on the schedule, after all. Besides, a drop in input prices is nice for European manufacturers, especially in Germany, the engine of growth. Granted, yesterday’s industrial production was a sad -2.15% y/y and the chart is not encouraging, but those outcomes came before commodity prices started falling.
Is it possible German manufacturing picks up on demand from Asia and falling input prices? Yes. The PMI’s are still over the boom/bust line of 50. Q3 could bring a trade deficit, but a resilient economy can overcome it. The Trading Economics forecast for Q2 is 1.1% (due end-July), a drop from 3.8% for Q1 but not a negative. Bottom line—Europe could have been saved by excessive pessimism. Note this is decidedly the minority point pf view and only a suggestion, not a forecast. Now if only Russia could be wished away.
And the meaning of Russia today is a single thing—oil. The oil market is nuts. Everyone knows that. Back in the last crisis, there was a point when there was more oil traded in futures than existed, not to mention wild swings driven by …. nothing at all. What about going under $100 this week? Fear of recession? What happened to those supply constraints even from the mighty Saudis? Bloomberg reports the oil market is in good form as shown by backwardation. “Nearby oil contracts continue to trade at a big premium to contracts for later delivery. The downward curve slope, known as backwardation, is a hallmark of a very tight physical oil market. At about $4 a barrel, the front-to-second front month backwardation is near its strongest ever. “
If not basic supply and demand, which really should NOT seesaw every day, then it’s trader positioning. “Liquidity in oil market futures is very poor, leaving them vulnerable to anyone unwinding a large position or selling forward contracts. Both happened this week. Over the summer, several big producer-hedging deals are likely, including the annual deal used by the Mexican government to lock in prices for the following year. On Tuesday, oil traders reported Wall Street banks buying put options for 2023 in large size — likely a sign that a big client was in the market hedging oil prices. Don’t misinterpret one day’s price decline as presaging a relaxation of the pressure that’s pushed Brent up by more than 50% in the past year.”
Whew, we needed that dose of reality-checking. What we learn from it is that deduction in economics/finance is riskier than you think. We do get perverse outcomes, quite often, in fact, and much of the time the cause is trader positioning and/or market conditions, especially liquidity, and nothing whatever to do with fundamentals. So are we wasting our time this time choosing between inflation and recession as the main price driver? In a word, yes.
For example, today’s payrolls might have some immediate effect—it usually does—but longer-term, by which we mean 3-6 months, none at all. Payrolls would have to fall massively and unemployment to rise up impossibly high for the Fed to think twice. Unemployment is 3.6% now and would have to get to what? 7-8% before the Fed has to care. It can’t happen in a single month from our current jumping off point. So payrolls is not the place to look for clues. Next week’s CPI data? That’s more like it. If another jump is in the cards, and the Fed seems to think so, then we are on our merry way to 75 bp at the July meeting and maybe the September, too—something not expected now.
Besides, by September we may know more about how the Ukraine war is going to end. Wishful thinking, probably, because the Russians excel at suffering, but by then perhaps Russia has indeed cut off the natgas and/or other outcomes that will give us something else to worry about. As things stand, the US will have the Fed funds rate nearing 4% by year-end while the ECB will have – what? Nothing close. Japan will stick to its weird curve control and nobody knows whether the BoE can get out of its 25 bp-only rut. From a yield perspective, the US is the clear winner. We keep warning against betting the ranch because it’s so obvious it can’t be foolproof (and because FX traders are as perverse as any other), but still.
Bottom line, deduce ye not.
This is an excerpt from “The Rockefeller Morning Briefing,” which is far larger (about 10 pages). The Briefing has been published every day for over 25 years and represents experienced analysis and insight. The report offers deep background and is not intended to guide FX trading. Rockefeller produces other reports (in spot and futures) for trading purposes.
To get a two-week trial of the full reports plus traders advice for only $3.95. Click here!
 previous

